Optimizing Sustainable Structures With HSS: A Comprehensive Guide
By Cathleen Jacinto, PE, SE, and Holly Schaubert, PE
The importance of quantifying the environmental impact of different structural materials is growing, necessitating that designers and contractors understand and communicate it within design, construction and owner teams. When selecting building materials for our projects, making informed decisions is crucial. Is there one material we should choose that is more sustainable than others? This article aims to build our knowledge base, enabling us to make informed decisions when selecting materials with sustainability in mind. We will share results of case studies that have been performed comparing various building materials such as steel, concrete and wood, as well as a deep dive into a review of HSS and other steel materials. We will also discuss specific and practical ways to optimize HSS design in the effort to not only lower material tonnage and fabrication costs but ultimately to also reduce carbon emissions. These topics are covered in three distinct sections of this article:
A. Fundamentals of Steel and HSS Sustainability
B. Insights from Steel, Concrete, and Wood Case Studies
C. Using HSS to Reduce Tonnage, Cost, and Embodied Carbon
A. Fundamentals of Steel and HSS Sustainability

Essential to an informed decision on material selection is an understanding of the basis for a material’s cradle-to-grave environmental impact within the context of a building’s full life cycle. For reference, this STI Article offers groundwork in describing sustainability terms including EPDs, GWPs and LCAs.
It is crucial to look at a building’s full life cycle, from a material’s Global Warming Potential (GWP) value to end of life impact. Focusing solely on a building material’s manufacturing phase and its GWP value would overlook a significant portion of the building’s life cycle and its overall potential impact to the environment. Below is a summary of the four modules that comprise a Whole Building Life Cycle Analysis (WBLCA), as illustrated in Figure 1:
- Module A – Product Stage: Raw material supply and sourcing of materials and delivery during the construction process; from extracting and manufacturing raw materials (A1-3) to transporting and constructing or erecting materials (A4-5)
- A1: Raw material supply
- A2: Transport raw materials to manufacturing
- A3: Fabrication/manufacturing
- A4: Transport to site
- A5: Construction
- Module B – Use Stage: Operational use of a building (B1-B5)
- Module C – End of Life Stage: Deconstruction / demolition process including transport, processing of waste, and disposal (C1-C4)
- Module D – Beyond System Boundary: Reuse, recovery and recycling potential
“Cradle” refers to the beginning of the life cycle, “gate” is the exit point of the manufacturing facilities, and “grave” is the end of the life cycle.
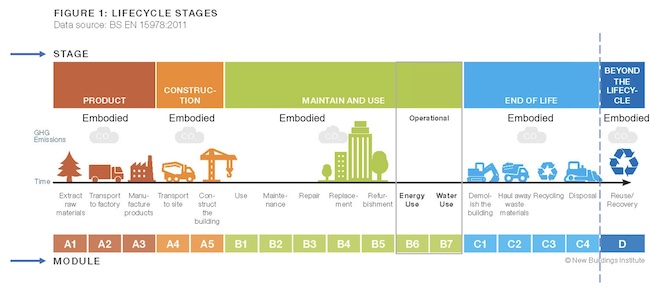
Building designers and contractors can impact Module A as we select our building material and assess its GWP value. The building material we choose can also greatly impact Modules C and/or D as we look to the potential waste and/or recyclability of a building material.
Sustainability of Steel and HSS
The average new structural steel member contains 93% recycled steel. Also, 98% of structural steel is recycled at the end of its life cycle.6 Steel recycling conserves valuable resources and diverts materials from landfills without any loss of material strength in the recycling process. According to the American Iron and Steel Institute (AISI), a single ton of steel recycled conserves 2,500 pounds of iron ore, 1,400 pounds of coal and 120 pounds of limestone. There are typically 60 to 80 million tons of steel scrap recycled per year into new steel products in North America.8
It is important to highlight the recyclability of steel as recycled materials are one factor that contribute to the carbon footprint of structural steel. For structural steel, the majority of the environmental impact of steel occurs before the steel piece leaves the mill gate (Module A1 in Figure 1), and a smaller impact results from the fabrication portion of the steel supply process (Module A3). Assessing the quantity of recycled material used in the manufacturing process and understanding the manufacturing process itself provides valuable insight into the embodied carbon of steel.
HSS is produced from flat sheet steel in coil form that is then cold-rolled into HSS sections. There are two primary methods to manufacture coil used to produce HSS: Basic Oxygen Furnace (BOF) or Electric Arc Furnace (EAF). Basic oxygen furnaces burn coal or natural gas, and primarily use raw materials in the form of virgin iron ore to manufacture steel. In addition to raw materials, BOF processes also use approximately 35% recycled material, or steel scrap. On the other hand, EAF processes are electricity-driven and are largely dependent on the carbon intensity of the local electrical grid that produces its steel. Recycled material, or steel scrap, is the main ingredient in EAF processes, with approximately 60% to 70% recycled material for coil used in HSS production. EAF processes utilize a higher amount of recycled material and an electrical grid that can be controlled with greater efficiency. In short, steel made primarily from EAF processes result in less carbon emissions overall. For further information, this STI article provides an in-depth discussion of the BOF and EAF manufacturing of coil into HSS.
There is a shift toward EAF-produced coils as the feed stock for HSS production. Also, with the increase in the number of solar fields and other ongoing efforts to increase efficiency in the electrical grid that powers EAF mills, the impact of HSS production on global warming continues to decrease.
- EAF steelmaking has 75% less emitted CO2 than BOF processes.6
- In 2020, approximately 70.6% of steel produced in the United States was made using EAF.7
- Approximately 71% of steel produced globally is made using BOF.
Note that there is a significantly higher percentage of EAF steel found domestically (70.6%), rather than abroad (only 29%), resulting in domestic steel being a more assured sustainable choice.7 Therefore, to increase the likelihood to procure steel and HSS manufactured by EAF processes, it is recommended to specify domestic steel producers to supply steel for our projects. To better ensure HSS is sourced domestically for your project, it is recommended to check the availability of desired HSS sections. If the HSS sections are readily available by domestic producers, fabricators will not need to source steel from international producers. The Steel Tube Institute (STI) offers a Capability Tool to assist designers in confirming that the HSS specified on projects are on the regular rolling schedule for domestic producers (indicated by a filled dot) and can be produced on demand with a large quantity of HSS (indicated by a blank dot). By clicking on the dot, domestic producers who produce that HSS section are listed.
HSS Environmental Product Declarations (EPDs)
Currently, there are two types of HSS EPDs available:
The STI HSS member producers have published facility-specific EPDs These are typically fabricated EPDs, however, it is important to verify whether it is a fabricated or unfabricated EPD HSS EPDs primarily focus on the A1 to A3 phases, detailed below. Unfabricated HSS EPDs examine the environmental impact from raw material extraction through HSS production, while fabricated HSS EPDs take it one step further to include the final fabrication phase.
Global Warming Potential (GWP)
Unfabricated HSS GWP

The EPDs include a detailed breakdown of the GWP within each of the A1 to A3 phases. For Unfabricated HSS, the GWP in the A1 phase is based on the steel coil production. Refer to Figure 2. The industry-average unfabricated GWP value for coil production is 1640 kgCO2e, as referenced in Table 1. The transportation of the steel coil to the HSS production facility is analyzed at the A2 stage (15.1 kgCO2e), followed by the production of HSS sections in the A3 phase (62.3 kgCO2e), resulting in a total GWP value of 1710 kgCO2e for unfabricated HSS. The unfabricated GWP then serves as the baseline in determining the A1 value for the fabricated GWP.

Fabricated HSS GWP

In Fabricated HSS EPDs, the A1 phase includes steel coil production, transport to the HSS production facility, and HSS production. Refer to Figure 3. It is also assumed that 1.077 tons of HSS are required for every 1.0 tons of fabricated HSS, therefore the unfabricated GWP is multiplied by 1.077 to determine the fabricated GWP in the A1 phase. For the industry-average Fabricated HSS EPD, our A1 is 1850 kgCO2e. Subsequent stages, including A2, which is transportation from the HSS production facility to the fabrication facility (44.6 kgCO2e), and A3, fabrication of HSS sections for construction (96.7 kgCO2e), resulting in a final fabricated GWP value of 1990 kgCO2e. Table B summarizes this breakdown of GWP values for fabricated HSS.

The above highlights the duplicated A1 to A3 process for HSS fabricated EPDs, essential for understanding the environmental impact associated with both the initial coil to HSS production and the subsequent fabrication stages within the life cycle of HSS.
It is evident that the steel coil source significantly contributes to the total GWP of HSS. Currently, in both industry-average EPDs and many facility-specific HSS EPDs, the GWP for coil is derived from an industry average, failing to fully encompass the HSS production that utilizes more environmentally sustainable EAF coil. There is an ongoing effort to develop EPDs specific to the upstream mills that manufacture coil used to produce HSS. This heightened level of transparency will offer an even greater level of transparency and understanding of the steel supply chain and its corresponding environmental impact.
B. Insights from Steel, Concrete, and Wood Case Studies
Looking at the full cradle-to-grave or cradle-to-cradle life cycle of a building is important in material selection. Some material may have a high GWP value, but its environmental impact at its end of life is small, or vice versa. To understand the impact of different building materials, we will explore results from three comparative case studies that have been performed.
The first case study was performed by Magnusson Klemencic Associates (MKA) and summarized in a paper dated in 2017 titled “Quantifying Environmental Impacts of Structural Material Choices Using Life Cycle Assessment: A Case Study.”8 A seven-story, 85-foot tall new construction office building was designed in four different framing systems that included mass timber, steel, and concrete, with a focus on studying the embodied carbon impacts. The following four designs were studied:
- Design A: Timber-framed structure with concrete columns below Level 2, typical nail laminated timber flooring, and concrete slab at Level 1 and 2
- Design B: Steel-framed structure with concrete columns below grade, typical concrete slab over metal deck, and concrete slab at Level 1
- Design C: Concrete-framed structure, typical PT slabs, and mild reinforced concrete slab at Level 1
- Design D: Concrete-framed structure and typical mild reinforced concrete slabs
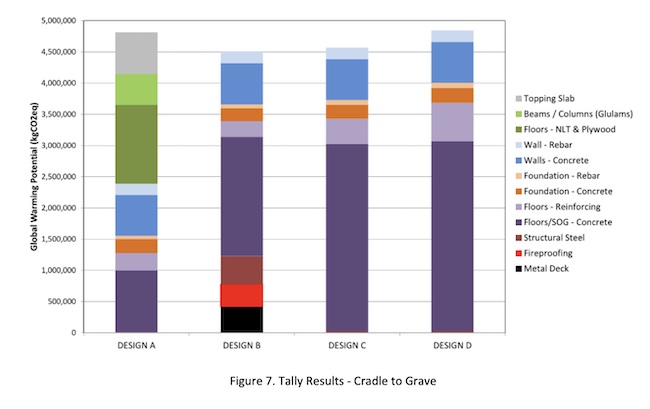
The results of the LCA (Life Cycle Assessment) performed in this case study and illustrated in Figure 4 show that the timber floor scheme (Design A) contains a higher global warming potential than the steel framed structure (Design B). One reason is that there is an increase in GWP for the timber structure when considering the end of life phase. This case study assumed the wood components would decompose or be incinerated at the end of its life. Biogenic carbon does not appear to have been included in the GWP in this case study and would . The conclusion of this case study is that when considering the full life cycle of the building, no single material can be chosen as a clear “winner” in materials.
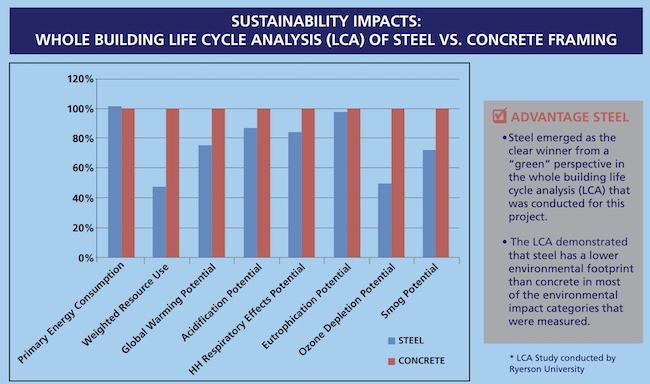
The next case study we will focus on compares steel and concrete framing to support a six-story office building in Canada, and was conducted by the Canadian Institute of Steel Construction (CISC).9 This case study explores tonnage, cost and embodied carbon. Figure 5 below illustrates the outcomes of the sustainability analysis. The project’s comprehensive life cycle assessment affirmed steel as the top choice from an overall sustainability perspective, as well as showcased its lower environmental impact in most measured categories.
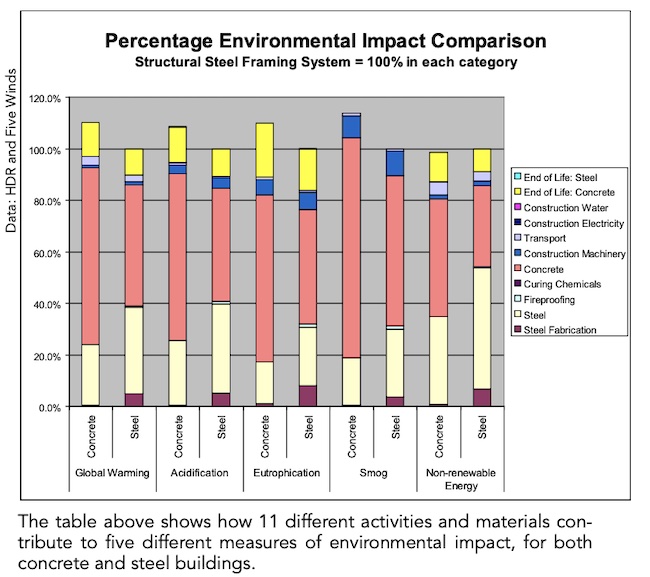
The last case study to highlight was conducted by the American Institute of Steel Construction (AISC), PE International (an environmental consulting firm), and HDR (an AEC firm). LCAs were conducted for two existing, analogous buildings with office occupancy located in Omaha, Nebraska. 10 The steel building, the Methodist Women’s Hospital Medical Office Building, is 151,910 sq ft and 5 stories tall with 1,211 tons of steel. The concrete building, the University of Nebraska Medical Center Durham Research Center, is 280,000 sq ft and 8 stories tall, with 15,650 cubic yards of concrete. It was found that steel had a lower environmental impact in four of the five categories evaluated, though the differences in these categories did not reach a confidence threshold of a 15% difference to conclusively recommend one material over the other.10 Figure 6 summarizes a comparison of environmental impact between steel and concrete, and it is interesting to note the impact of end of life to the overall life cycle. Below is a summary of the findings:
- Global warming potential: Structural steel demonstrates a 9% reduction in CO2 equivalent emissions per square foot compared to concrete.
- Steel outperformed concrete in acidification potential, eutrophication potential, and smog potential.
These three reviewed case studies underscore the intricate nature of sustainability assessments in building materials. Steel demonstrates a notable environmental advantage in terms of reduced carbon emissions and other environmental impact factors. We also see that it is important to evaluate the entire life cycle of a building when making informed decisions on building with sustainability in mind. Moving forward, our assessment will delve deeper into strategies for further minimizing the embodied carbon impact associated with steel construction.
C. Using HSS to Reduce Tonnage, Cost, and Embodied Carbon
When evaluating the GWP values in EPDs during a project’s design phase, it is crucial to acknowledge that direct comparisons cannot be made between materials, such as steel and concrete, or even within steel materials like wide flange and HSS. GWP values are based on the material’s unit of measurement, cubic yards for concrete, metric tons for steel, etc. The varying strength and stiffness of materials significantly influence the quantity required to resist the same loading, making it impractical to use a 1:1 comparison. Therefore, to ensure an accurate comparison, the structure as a whole would need to be analyzed and designed in each material separately, considering all aspects that contribute to the project GWP. Only a comparison based on functional equivalency can reliably direct design decisions, and only when conducted within the context of a comprehensive building design.
Therefore, the recommended approach for designing sustainable structures is to prioritize member optimization and minimize material usage rather than choosing one material solely for perceived sustainability.
To illustrate this, we will look at two different steel materials, wide flange and HSS members. We at STI consistently advocate for engineers to use the best steel solution for their project’s specific needs. Due to its closed section and low radius of gyration, HSS is highly efficient in transferring axial loads and torsion and are well suited in column, brace, truss and girt applications.
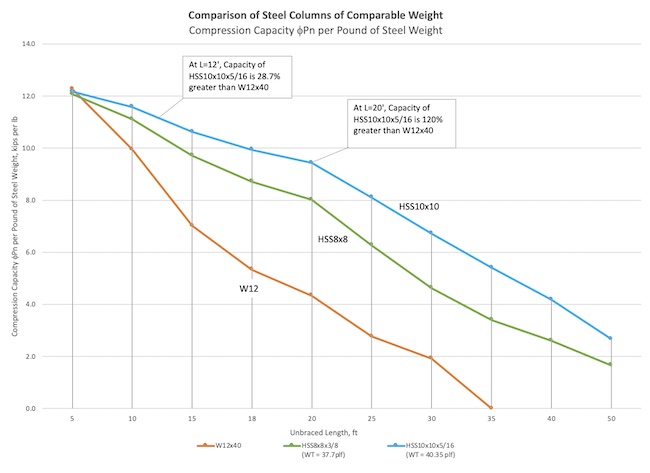
At an equivalent unbraced length, HSS columns exhibit a higher compressive strength than their WF counterparts of the same weight. For instance, at a typical story height of 12 feet, columns within a similar weight range of 37 to 41 plf result in the following compressive capacities:
- W12x40 column: φPn = 352 kips
- HSS8x8x3/8 column: φPn = 400 kips, a 13.6% increase in capacity
- HSS10x10x5/16 column: φPn = 453 kips, a 28.7% increase in capacity
Figure 7 below compares these three steel columns of similar weight, illustrating the compression capacity, φPn, per pound of steel across a range of unbraced lengths. As the unbraced length increases, the difference in capacity between WF and HSS also increases, with HSS capacity exceeding WF capacity. At a length of 20 feet, the HSS10x10x5/16 capacity is 120% greater than the capacity of a W12x40 column. The results highlight that HSS columns deliver higher compressive capacity per pound of steel compared to WF sections of similar weight, underscoring the efficiency of HSS columns in axial load applications.
We will now expand our steel material comparison, shifting our focus from capacities to the consideration of embodied carbon. Table C show current GWP values based on the industry-average fabricated HSS EPD and fabricated WF EPD.
| Product | Global Warming Potential (GWP) A1-A3 (kgCO2e / MT) |
|---|---|
| Hollow Structural Section (HSS) | 1990 |
| Wide Flange (WF) | 1220 |
Calculate the steel Global Warming Potential (GWP) for steel columns of comparable weight.
1 metric ton (MT) = 2204.62 lbs

Figure 8 expands the calculation above to show a comparison of the same columns over a range of unbraced lengths. The y axis shows the GWP values for the columns per kip of design compressive capacity, φPn. The chart shows that the embodied carbon in the WF and HSS columns are relatively equivalent up to approximately 16 ft of unbraced length. For unbraced lengths greater than 16 ft, the HSS column yields less embodied carbon per kip of compressive capacity. This shows the importance of reviewing embodied carbon in the context of design capacity and functional equivalence rather than a straight comparison of base GWP values.
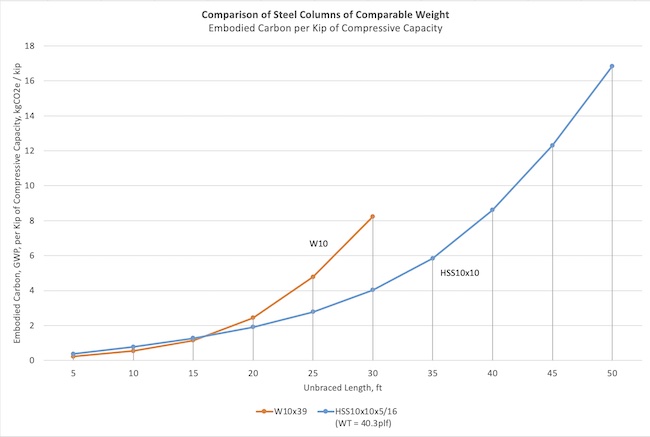
Comparison of Embodied Carbon per Kip of Compressive Capacity
We will continue the comparison by looking at column design from a different perspective by analyzing a steel column with factored load demand of Pu = 200 kips spanning an unbraced length of Lb = 18ft. Table D summarizes potential column sizes to transfer the imposed load, their corresponding steel weights and steel GWP values.
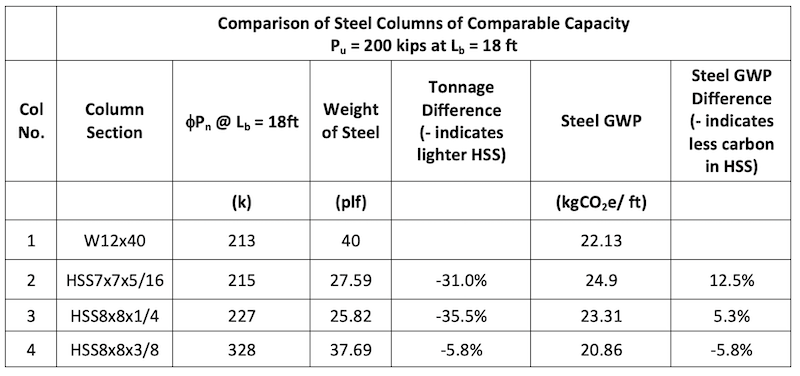
Comparison of Steel Weight and Steel GWP
A negative tonnage difference indicates that the HSS column is lighter than the WF column. The Table shows that HSS columns #2 and #3, of comparable compressive capacity to the W12, are lighter, allowing for a substantial reduction in steel tonnage by 30% to 35%. The decreased weight of HSS columns also translates to reduced steel transportation needs, potentially requiring fewer trucks for transportation to the project site (Module A4 in Figure 1). The comparison also highlights that the GWP values for columns #1 through #3 fall within a comparable range (22.13, 24.9 and 23.31 kgCO2e). While the HSS columns in this case exhibit slightly higher steel GWP values than their WF counterparts with similar compressive capacities, the difference is not significant.
Importantly, HSS column #4 demonstrates a lower embodied carbon than the W12 of similar weight, coupled with a higher compressive capacity. This analysis underscores that HSS is a compelling design choice with optimal axial capacities and the potential for equivalent or lower embodied carbon emissions.
Steel Perimeter and Surface Area
Materials applied to a structural frame, including fireproofing, enclosures, paint and weld metal, also contribute to the overall environmental impact of a structure. Square and rectangular HSS have approximately two-thirds the surface area of an open section of comparable capacity. This results in a reduction in painting material, weld metal, fireproofing and surface preparation (i.e. chemical cleaning, abrasive blasting, etc).
Our previous comparisons indicate that HSS sections with comparable capacity have smaller depths than their open section counterpart (e.g., 12” WF vs. 10” and 8” square HSS). Smaller columns are beneficial for floor plans constrained by space such as warehouses, parking spaces, etc. The axial capacity-to-weight efficiency in HSS opens up the possibility of utilizing smaller diagonal bracing and truss members, easing coordination with wall openings and floor framing depths.
Since surface area is based on the perimeter of a section, we have calculated the perimeter of HSS and WF sections for comparison. We will continue the comparison from Table D above for the 3 columns with comparable compressive capacity.
- W12x40, Perimeter of steel section = 55.25 in
- HSS7x7x5/16, Perimeter = 26.8 in → 51.5% less than W12x40
- HSS8x8x1/4, Perimeter = 31.2 in → 43.5% less than W12x40
We will explore how perimeter impacts global warming potential by focusing on cementitious spray-applied fireproofing, typically used in building construction. The GWP for 1” of cementitious fireproofing is 0.167 kgCO2e / in / ft, or kgCO2e per inch of perimeter per foot of member length. Multiplying this GWP for cementitious fireproofing for the same columns above results in the following Fireproofing (FP) GWP values:
- W12x40, Cementitious FP GWP = 9.23 kgCO2e / ft
- HSS7x7x5/16, Cementitious FP GWP = 4.48 kgCO2e / ft → 51.5% less than W12x40
- HSS8x8x1/4, Cementitious FP GWP = 5.21 kgCO2e / ft → 43.5% less than W12x40
The reduction in embodied carbon impact due to fireproofing is directly proportional to the reduction in perimeter of the section. The HSS sections result in lower GWP with respect to fireproofing GWP due to its reduced steel section perimeter and surface area. There is also the potential for further reductions in GWP when looking at column enclosures, as a reduced column depth could result in smaller enclosures or even no enclosures at HSS columns.
Finally, we will sum the total GWP resulting from both the steel GWP per Table D and fireproofing GWP calculated above.
- W12x40, Total GWP = 22.13 + 9.23 = 31.36 kgCO2e / ft
- HSS7x7x5/16, Total GWP = 24.9 + 4.48 = 29.38 kgCO2e / ft → 6.3% less than W12x40
- HSS8x8x1/4, Total GWP = 25.82 + 5.21 = 28.52 kgCO2e / ft → 9% less than W12x40
Therefore, when we consider both the steel GWP and cementitious fireproofing GWP, the total GWP value can be lower for HSS sections when compared to WF sections. Factors that contribute to this are the potentially lower tonnage for HSS and reduced perimeter and surface area of HSS.
Figures 9 through 11 summarize the above column comparison in chart format, and provides additional comparisons for three different column loading and unbraced length conditions:
- Factored Compression Demand, Pu = 200 kips and Lb = 18 ft
- Factored Compression Demand, Pu = 300 kips and Lb = 25 ft
- Factored Compression Demand, Pu = 475 kips and Lb = 40 ft
The steel columns presented for each load category are adequate to resist the demand, and the charts show weight of steel and total GWP due to the sum of steel GWP and fireproofing GWP. Percentages shown for the HSS columns indicate if the measurement is less than the WF column (indicated by a negative percent) or greater than the WF column (indicated by a positive percent).
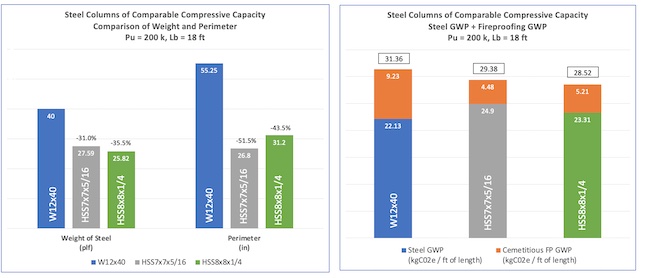
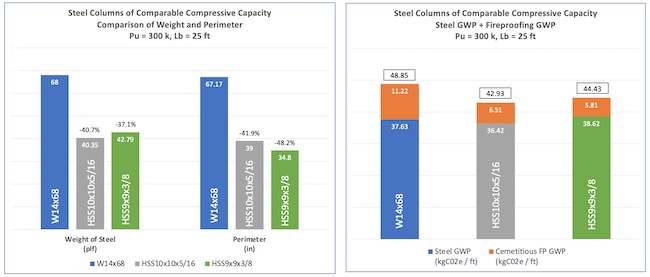
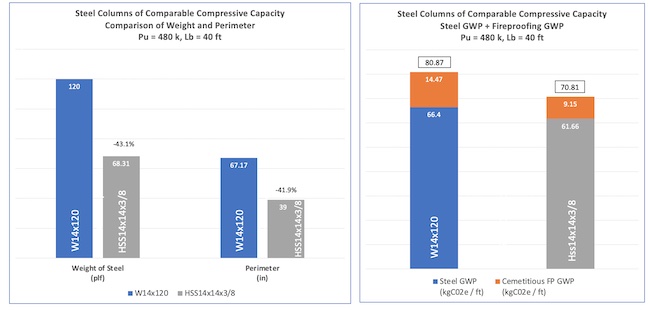
Based on these comparisons, HSS sections with comparable capacity to WF sections yield a 35% to 52% reduction in steel section perimeter and are 30% to 43% lighter. The embodied carbon in the HSS sections range from 7% less to 13% greater than their WF counterparts. Keep in mind that this is the GWP for the base steel alone. As discussed earlier, the decreased tonnage of HSS translates to reduced shipping needs, potentially requiring fewer trucks to transport material to the site. The smaller surface area also results in a reduction in fireproofing, paint and surface preparation. These advantages further reduce the GWP for HSS, help to close the gap in embodied carbon between HSS and WF sections, and may result in an overall lower embodied carbon footprint for HSS. The comparison indicates that overall, the GWP values are fairly comparable between WF and HSS, and that HSS offers a compelling design choice with optimal axial capacities, reduced tonnage, the potential for lower embodied carbon emissions, among other advantages.
Conclusions
When confronted with the need to select materials for a project with sustainability as a priority, it becomes essential to make well-informed choices. This involves not only understanding the basis of a material’s global warming potential but also recognizing its implications throughout a building’s entire life cycle, including its end of life considerations. It is noteworthy that the steel industry is currently showing a positive trend toward greener building materials, with 93% recyclability of steel and increasing usage of electric arc furnaces with efficient electrical grid systems. To enhance the chances of sourcing steel and HSS produced using more sustainable EAF processes, consider specifying domestic steel producers for your project and use the STI Capability Tool to confirm the availability of desired HSS sections, thus eliminating the need for international sourcing.
The recommended approach for designing sustainable structures is to prioritize member optimization and minimize material usage. The HSS and WF comparative studies underscore the advantage of HSS sections in resisting axial loading with reduced weight and perimeter at potentially less embodied carbon emissions to their WF counterparts. The potential reductions in embodied carbon emissions are even more noteworthy when considering reductions in fireproofing, paint and surface preparation due to a smaller surface area. This ability to lower an overall embodied carbon footprint highlights HSS as an appealing design choice that aligns with sustainability objectives.
References
- STI. 2022. “Environmental Product Declaration Hollow Structural Sections,” Steel Tube Institute
- AISC and STI. 2022. “Environmental Product Declaration Fabricated Hollow Structural Sections,” American Institute of Steel Construction and the Steel Tube Institute
- AISC. May 2017. “More than Recycled Content: The Sustainable Characteristics of Structural Steel,” White Paper by the American Institute of Steel Construction.
- Pak, A. Nov 2020. “Embodied Carbon: Key Considerations for Key Materials,” Canadian Architect.
- Raff, B. 2023. “Sustainability by the Numbers,” Modern Steel Construction, American Institute of Steel Construction, May issue.
- AISI. “Sustainability in Steel Recycling,” American Iron and Steel Institute.
- AISI. 2021. “Facts About American Steel Sustainability,” American Iron and Steel Institute.
- Davis, D., Johnson L., Doepker B., Hedlund M. 2017. “Quantifying Environmental Impacts of Structural Material Choices Using Life Cycle Assessment: A Case Study”. Canadian Institute of Steel Construction.
- CISC. 2014. “Comparative Case Study: Steel vs. Concrete Framing Systems”, Canadian Institute of Steel Construction, Markham, Ontario, Canada
- Wang, L., Troup L.N., Eckelman M., Hajjar J., October 2016, “Deconstructable Systems for Sustainable Design of Steel and Composite Structures”
- Weisenberger, G. 2010. “And the Winner Is…”, Modern Steel Construction, American Institute of Steel Construction, August issue.
- Hines. April 2022. “Embodied Carbon Reduction Guide”
- Gryniuk, M. Oct 2023. “Building Greener Part 1: Addressing Climate Change with Structural Steel,” Webinar, Steel Tube Institute
- Weisenberger, G. 2010. “The Whole Enchilada, Modern Steel Construction, American Institute of Steel Construction, February issue.
- Bowles, W., Cheslak K., Edelson J., January 2022. “Lifecycle GHG Impacts in Building Codes,” New Building Institute, Portland, OR.
Navigating Sustainability in Structural Engineering
Sustainability isn’t just a buzzword for Mike Gryniuk. We spoke with the founder and principal of Cora Structural to hear about his journey as an engineer, learn more about his important role in the SE 2050 Commitment Program for Structural Engineering Institute, and understand his passion for bettering the world through sustainable engineering.